
Keyword
Earth Science | Oceans | Ocean Chemistry | Pigments
144 record(s)
Type of resources
Topics
Keywords
Contact for the resource
Provided by
Formats
Update frequencies
Status
draft
-
This record contains data collected from the near-water surface sampling site off the Lucinda Jetty, as part of the Lucinda Jetty Coastal Observatory. Sample collection began the 9th of January, 2014. The data can be used for Ocean Colour sensor validation. Parameters measured include the absorption coefficients of the particulate and dissolved components of the water column and the phytoplankton pigment concentration and composition.
-
This data set contains the MODIS Aqua ocean colour satellite data from the period December 2002 to January 2004. The data are received as monthly composites, with a 4 km resolution, and are constrained to the region between 90E and 180E, and 10N to 60S. The data set is a level 3 product, where the chlorophyll accuracy has been assessed and the uncertainties in the product well established in a systematic and statistically robust way representing global rather than regional conditions. The data was sourced from http://modis.gsfc.nasa.gov/. The data are in hdf format, and consist of 96 files totaling approximately 850 MB. The Moderate Resolution Imaging Spectroradiometer (MODIS) administered by NASA Goddard Space Flight Center, is a 36-band spectroradiometer measuring visible and infrared radiation and obtaining data that are being used to derive products ranging from vegetation, land surface cover, and ocean chlorophyll fluorescence to cloud and aerosol properties, fire occurrence, snow cover on the land, and sea ice cover on the oceans, from a continuous global coverage every 1 to 2 days. The first MODIS instrument was launched on board the Terra satellite in December 1999.
-
Coastal Zone Colour Scanner (CZCS) composited mean-monthly maps for the Australian EEZ region. The original NASA monthly composites have been processed by John Parslow and Chris Rathbone of the CSIRO Division of Fisheries to produce, for each month, images which are the mean over the 8 years of sampling. These have then been very simply remapped to a 1/2 degree grid, compatible with the "regional seasonal ocean physical property maps". The maps are all in units of pigment/m3.
-
This biological overview for the Southern Surveyor voyage SS 07/2005. The voyage took place off the Western Australian Coast during July August 2005. This dataset has been partly processed and has not yet been archived within the CSIRO Marine and Atmospheric Research Data Centre in Hobart. Additional information regarding this dataset is contained in the cruise report for this voyage and/or the data processing report. On this cruise pigments and chlorophyll a were collected by Neale Johnston and later processed at CMAR, Hobart by Pru Bonham.
-
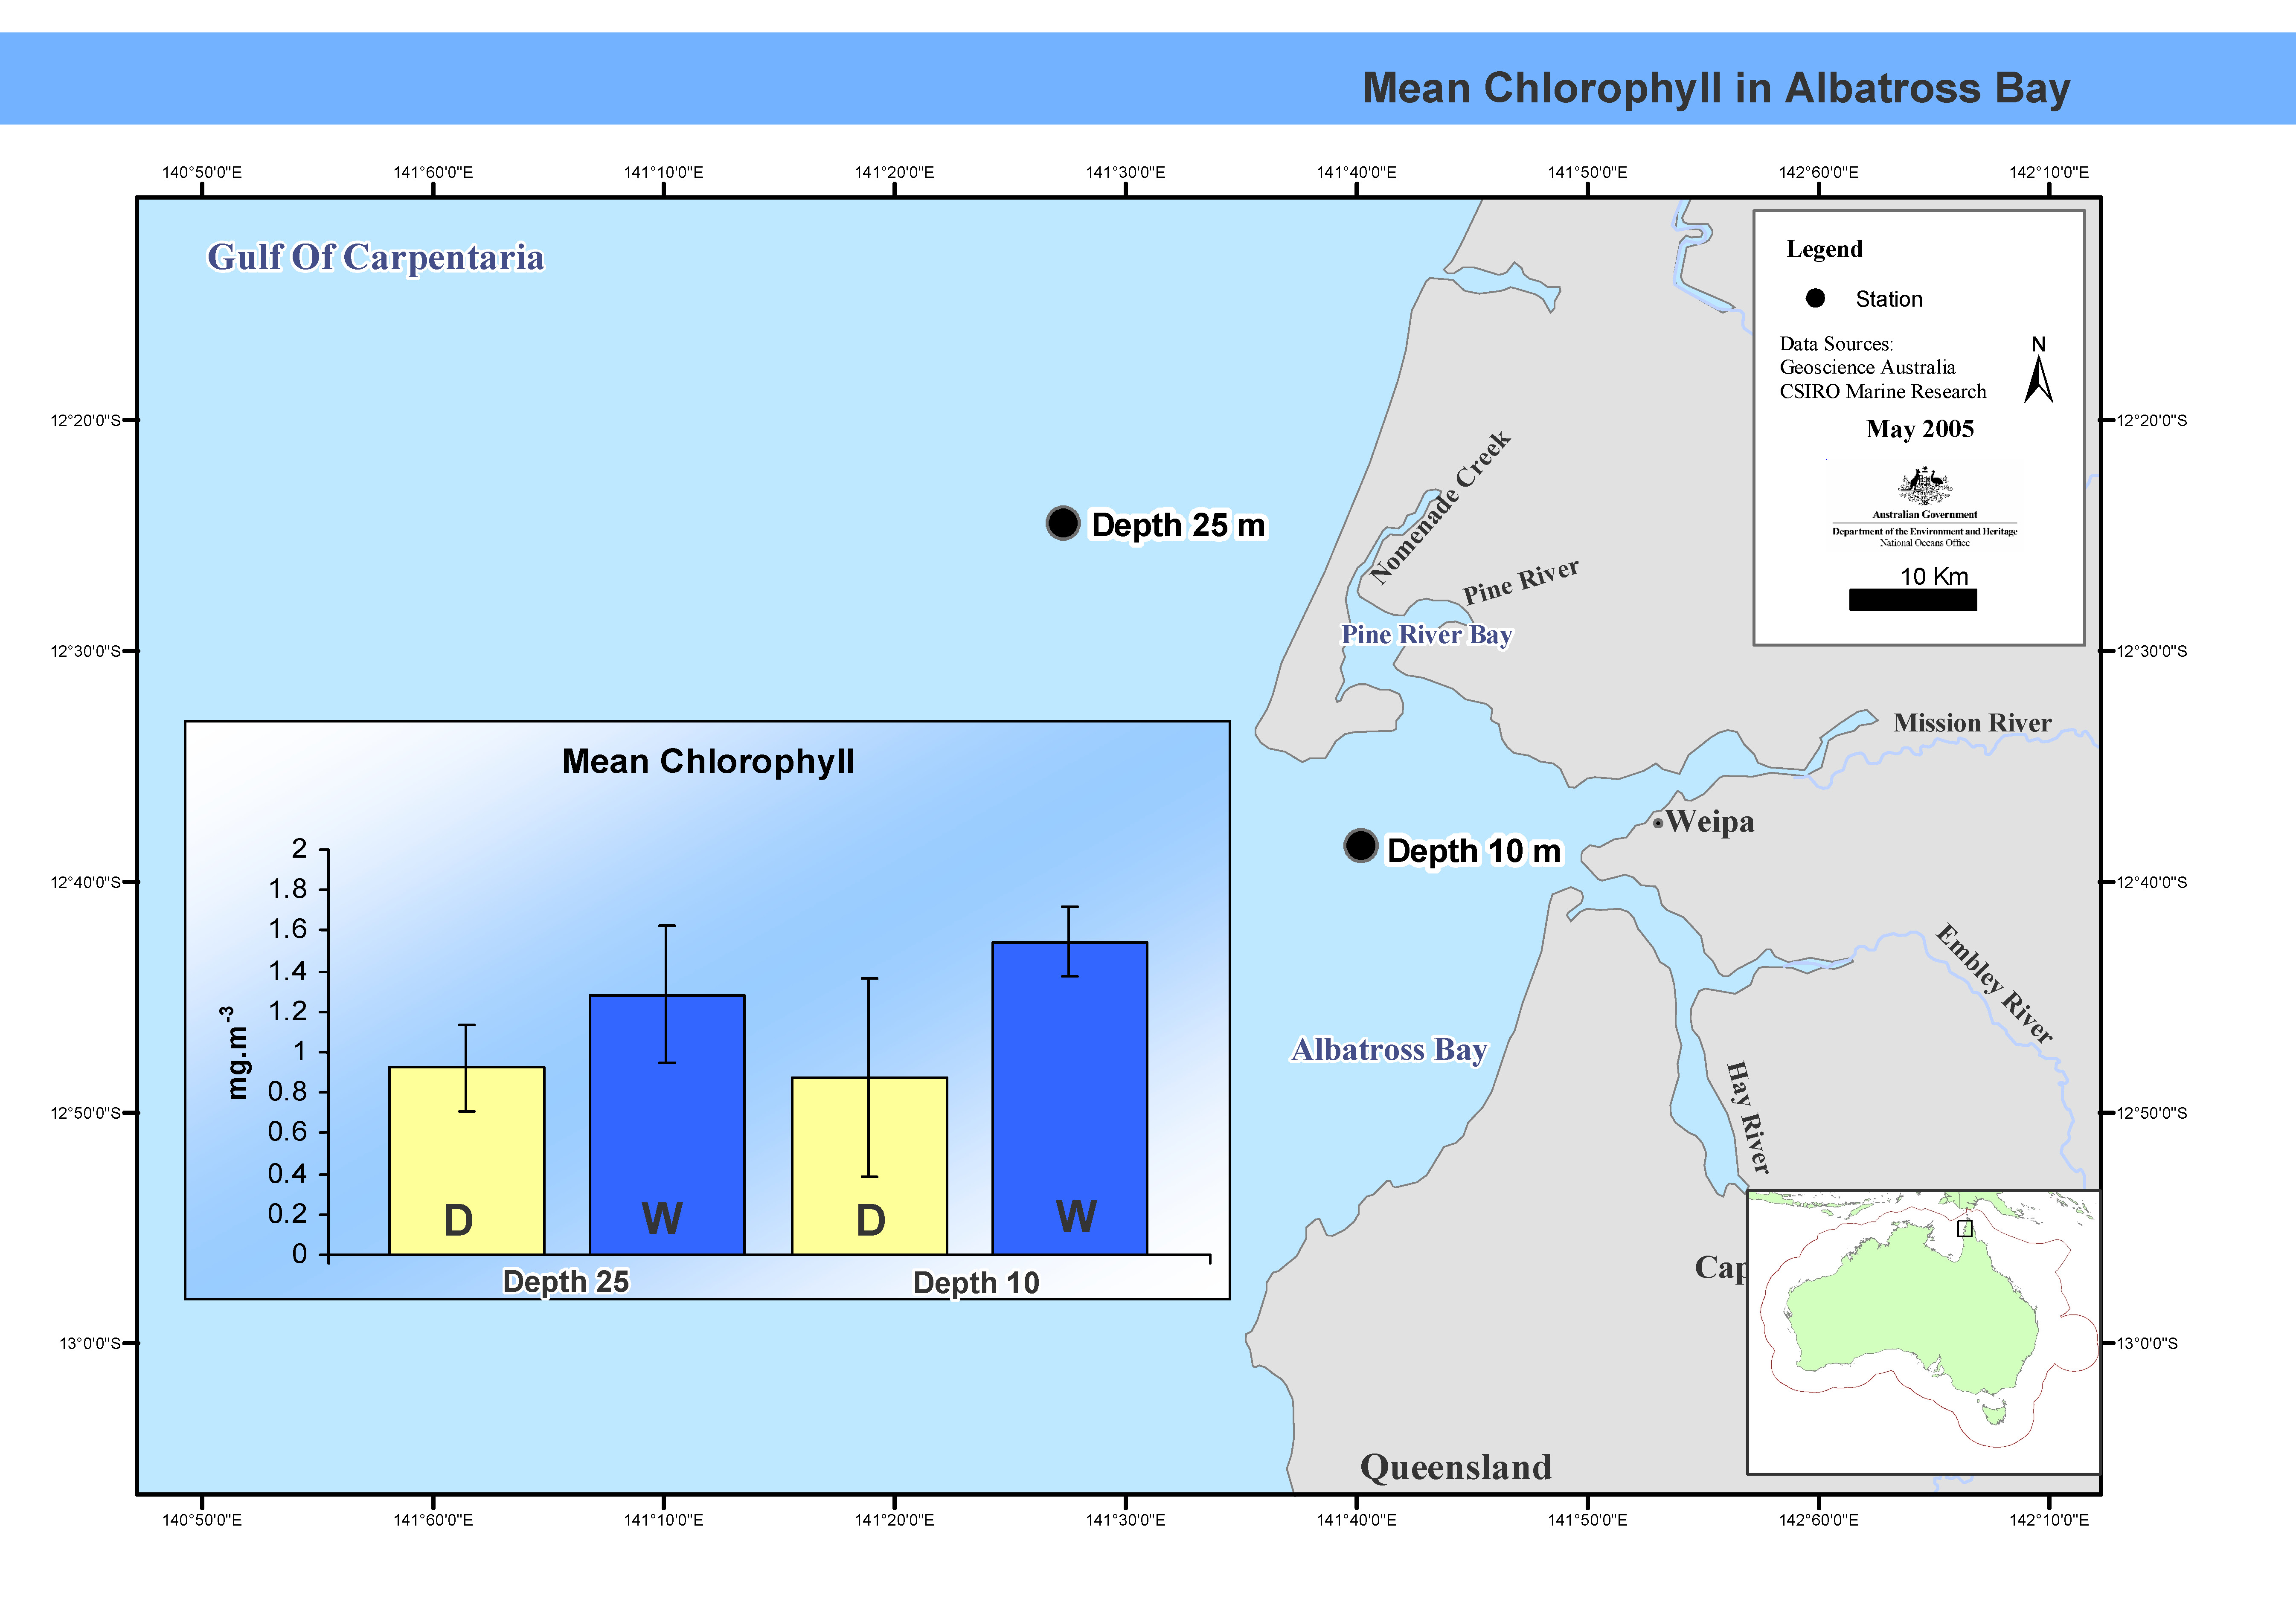
This map shows mean chlorophyll concentrations in Albatross Bay. Between February 1988 and February 1992 the FRV Jacqueline D completed nine cruises, seven in summer, two in winter, in Albatross Bay in the north-east Gulf of Carpentaria. Two stations, one 10m deep, the other at 25m, were sampled. Mean chlorophyl levels and primary productivity in the water column were measured. This map has been produced by CSIRO for the National Oceans Office, as part of an ongoing commitment to natural resource planning and management through the 'National Marine Bioregionalisation' project.
-
Despite the apparent importance of microphytobenthos and macroalgal populations as primary producers, primary productivity data and particularly data investigating the controls on primary productivity in WA shelf waters are sparse. We have investigated microphytobenthoc and macroalgal primary productivity in Marmion Lagoon by measuring oxygen evolution during a number of targeted incubations.
-
Data showing chlorophyll a concentrations in Albatross Bay, Gulf of Carpentaria. Phytoplankton pigment composition (chlorophyll a concentration) was measured in Albatross Bay, Gulf of Carpentaria, northern Australia. Four sites were sampled over six years between August 1986 and April 1992. In the last two years samples were taken at the bottom of the water column in addition to mid-depth. This data has been produced by CSIRO for the National Oceans Office, as part of an ongoing commitment to natural resource planning and management through the 'National Marine Bioregionalisation' project.
-
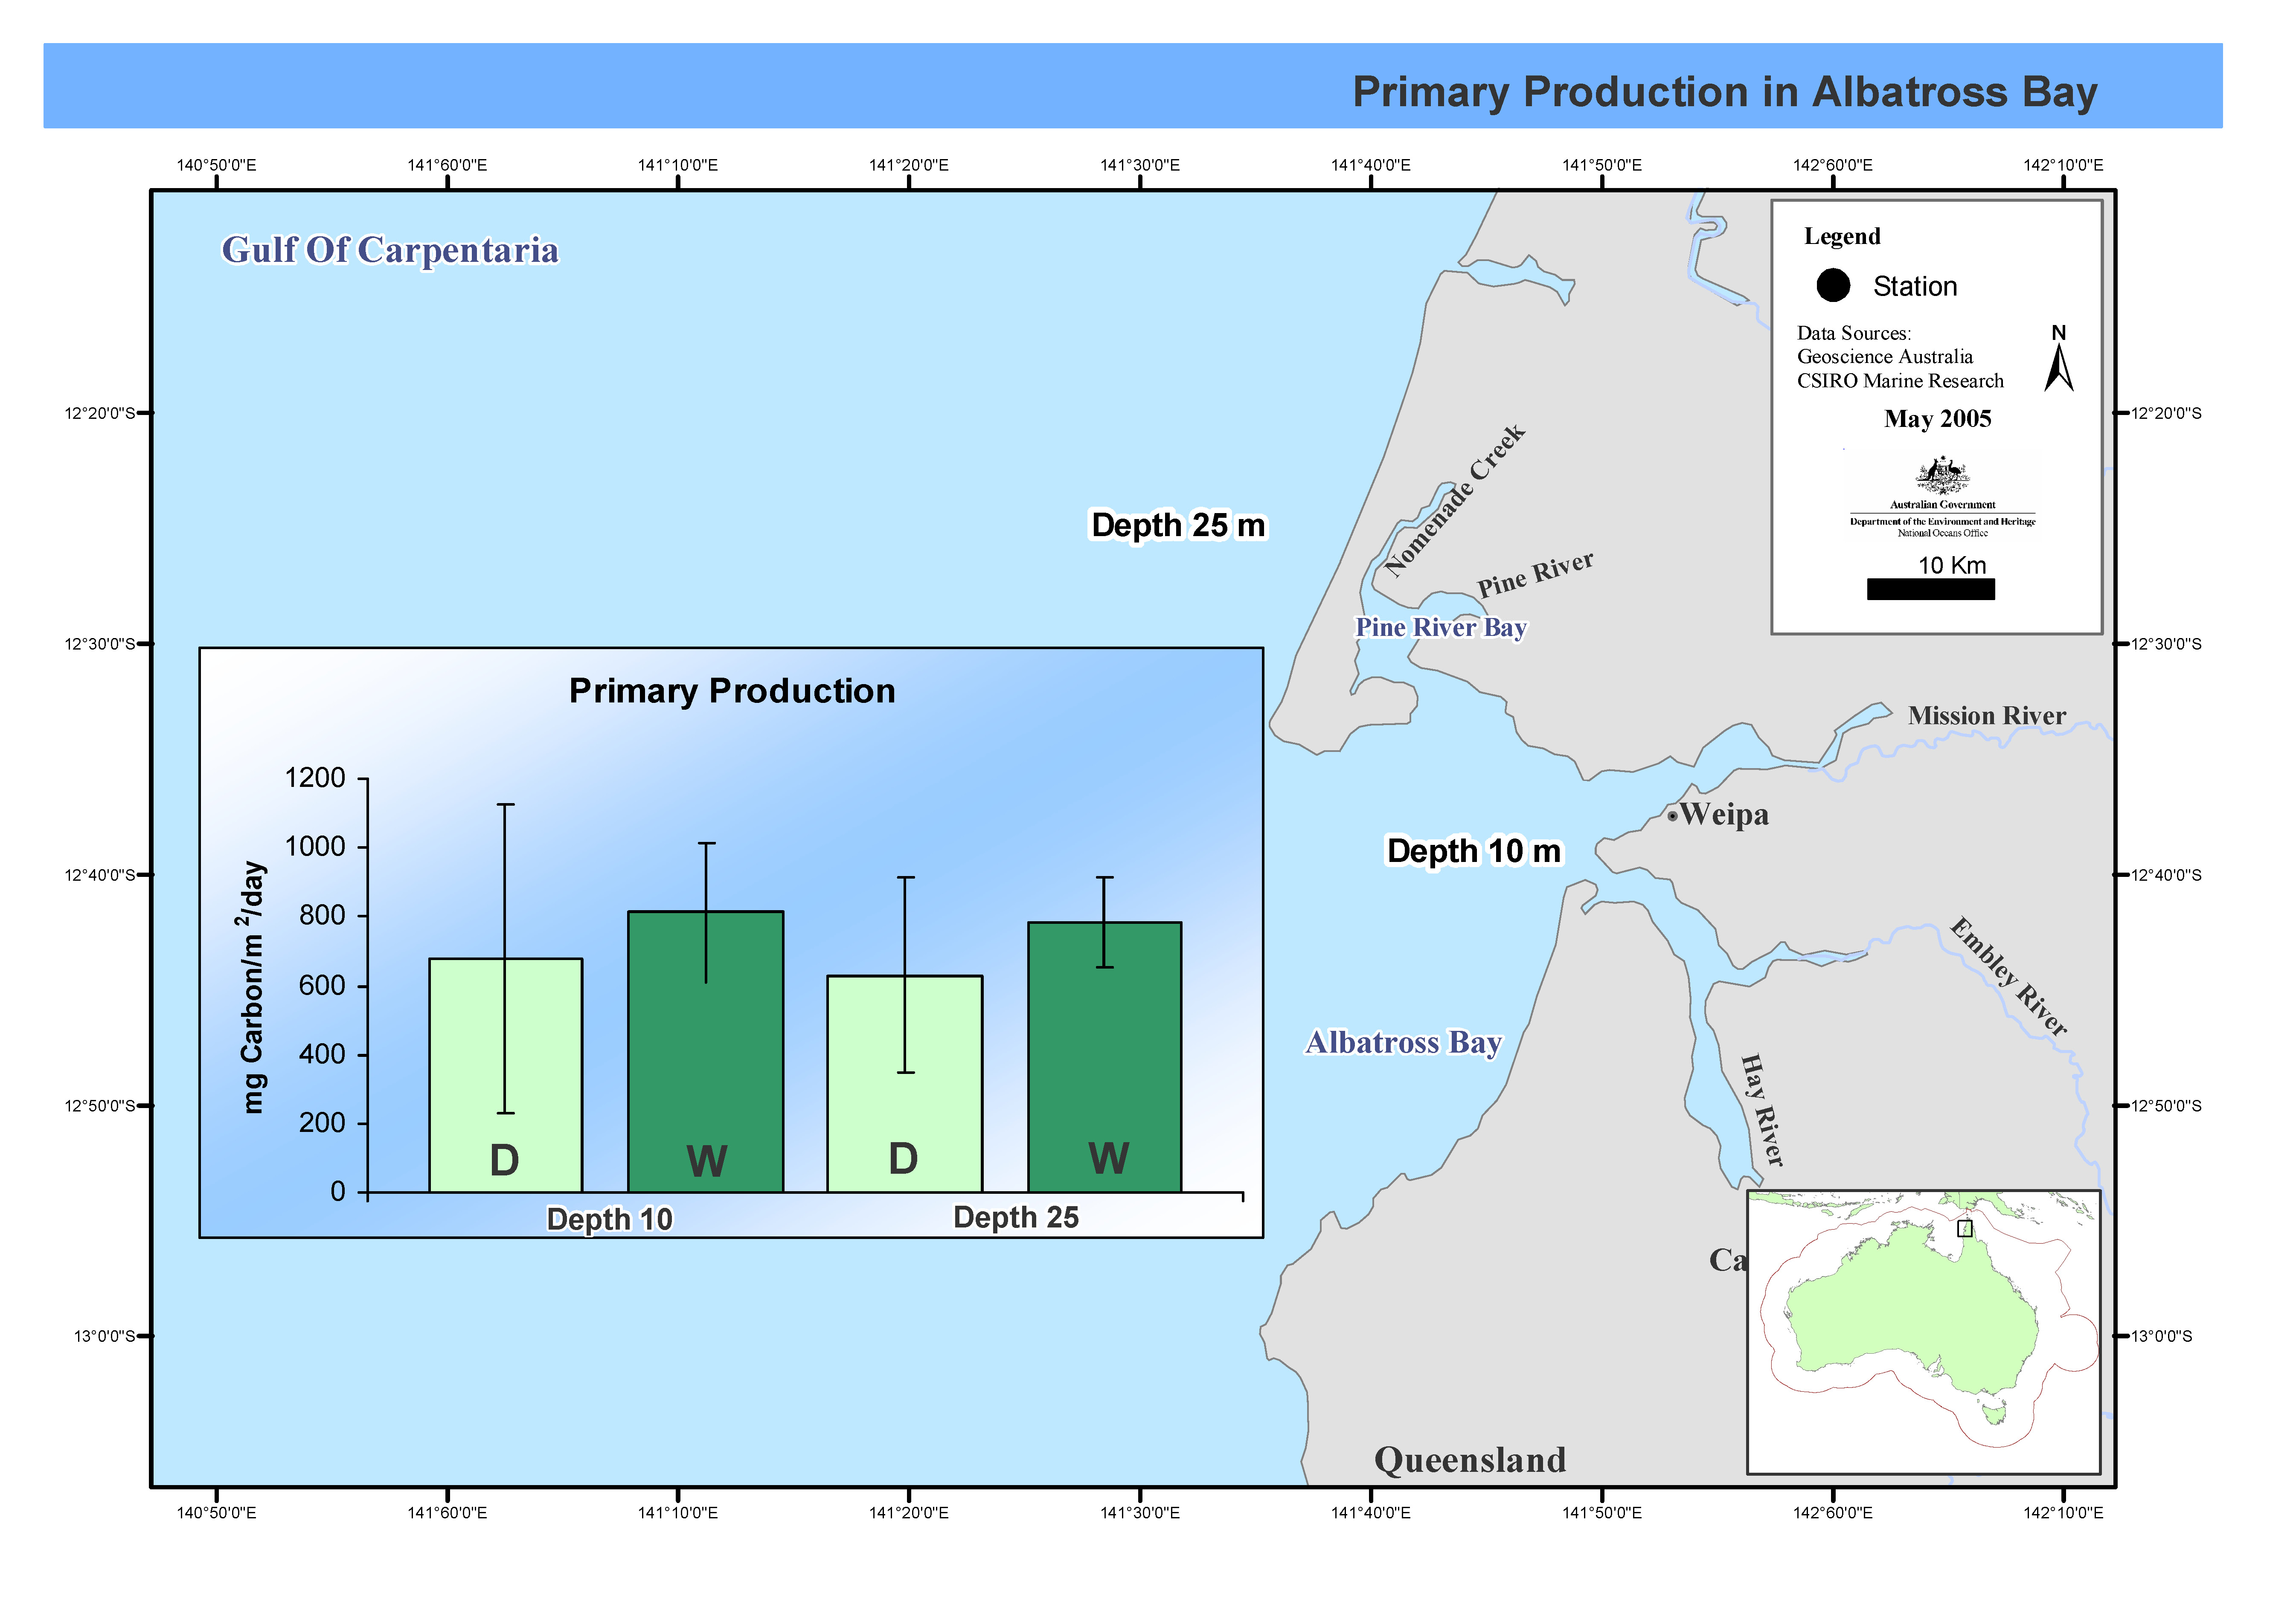
his map shows C14 primary productivity incubations at two stations over seven cruises in Albatross Bay during both the wet and dry seasons. Between February 1988 and February 1992 the FRV Jacqueline D completed nine cruises, seven in summer, two in winter, in Albatross Bay in the north-east Gulf of Carpentaria. Two stations, one 10m deep, the other at 25m, were sampled. Mean chlorophyll levels and primary productivity in the water column were measured. This map has been produced by CSIRO for the National Oceans Office, as part of an ongoing commitment to natural resource planning and management through the 'National Marine Bioregionalisation' project.
-
This dataset comprises the results of phytoplankton pigment composition analysed from samples collected as part of the Integrated Marine Observing Systems (IMOS) National Mooring Network - National Reference Station (NRS) field sampling. Pigment samples are taken for the complete water column (0-50m) and at the depths of the shallow WQM and the deeper WQM attached to the mooring at that site. Nine Sites are included in the IMOS NRS field sampling stations. Maria Island (TAS), Kangaroo Island (SA), Esperance (WA), Rottnest Island (WA), Ningaloo (WA), Darwin (NT), Yongala (QLD), North Stradbroke Island (QLD) and Port Hacking 100 (NSW). Sampling at these sites is conducted by several members of IMOS NRS Biogeochemical project. Sampling at the sites began between 29/9/2008 and 8/11/2010 and is currently ongoing for 7 sites. Sampling ceased at Ningaloo and Esperance (WA) sites in Aug/Sept 2013. Sampling is conducted monthly (Esperance and Ningaloo were 3 monthly) off small vessels. Depths sampled range from surface to 105 metres depending on the site. Depths are usually sampled at 10 metre intervals. Details including information on station locations, depths sampled and sample types collected are shown in the PDF link below extracted from the IMOS NRS NATIONAL REFERENCE STATIONS BIOGEOCHEMICAL OPERATIONS - A PRACTICAL HANDBOOK, Version 2.2 July 2012. A link to the full handbook is also provided which includes full details of the sampling regime and analyses. Historical data collected as part of CSIRO Coastal Monitoring program is available for three of the National Reference Station sites: Maria Island Coastal Station Data 1944-2008, Port Hacking 100m Coastal Station Data 1953-2010 and Rottnest Island Coastal Station Data 1951-2009. The links to the metadata and access for these data is provided below. Data storage and access is planned to be interoperable with other national and international programs through the IMOS Infrastructure. Station metadata can be found through this resource. Data is freely available through the AODN portal: https://portal.aodn.org.au
-
This record is an overview entry for biological data collected on Diamantina cruise Dm 1/62. This cruise took place in the northeast Indian Ocean, Banda Sea and Java Sea during 12 February to 25 March 1962, under the leadership of B. Newell & D. Rochford. Biological data collected on this cruise include primary production rates; organisms with/without chlorophyll, total particles and occurrence of dinoflagellates from phytoplankton stations; pigment samples; and zooplankton biomass. Please note: This metadata record is a preliminary entry derived from information in the cruise report. Individual data types - which may span several cruises - will be indexed separately within this metadata system in due course.